Looking for how to see options charts in TradingView? You have come to the right place. This guide will teach you how to use the tradingview’s amazing drawing tools to analyze step indices, crash and boom indices, range break indices, volatility indices, and other option markets for free.
Tradingview, as we know, is one of the best free charting platforms that has both mobile apps, desktop applications and browser versions for analyzing currency pairs. However, you can only see binary options on the newly developed tradingview extension for binary options.
With this new tradingview for binary, you can analyze the market behavior in ways that the normal DEV platform simply cannot, thus enhancing your ability to identify potential trade setups and leverage them with minimal risk.
Also, with this tradingview extension for binary options, you will have access to option trading indicators like balance of power, bollinger band, average directional index, and other indicators absolutely for free.
So without further ado, let’s get started
Recommended:
2.How to Use TradingView for Binary Option Trading.
3. How to Add Crash 1000 index chart on Tradingview
4.How To Add Volatility 75 Index on Tradingview
How To See Options Charts In Tradingview (Steps)
Depending on the type of option market you want to trade, seeing the options charts in tradingview takes a few different steps, but with this section, you are covered. So follow the steps below to see options charts in Tradingview.
Step 1: Visit the Tradingview Extension for Binary
Tap this link to visit the tradingview extension for binary options. You will be taken to a page looking like the picture below.
Step 2: Select the “option market” you like to trade:
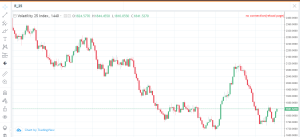
Once you are on the page as directed in the previous step, you will see a box to change the type of option at the top left corner of the chart. By default, “R-25” is selected. Remove it.

Then place your cursor on the box and you will see different option market types like forex, commodities, synthetic indices, and others. Select the option market you want to trade. I have selected “Synthetic index market” as shown below.

You can then select any of the options to see the chart.
Step 3: Begin Your Technical analysis.
Once you select any option, the real market data will be displayed on the chart. You can then go ahead and utilize the tradingview drawing tools and the technical indicators to analyze your option chart and place your trades.
Recommended: Understanding the Tradingview for Binary UI
Note: You can’t connect your option broker to this tradingview extension yet. For you to place your orders, you need to visit your broker’s platform and execute your trade as determined in the charting platform.
Does TradingView have options?
The normal tradingview platform for currency pairs doesn’t have options chart. However, if you want to analyze binary options on TradingView, you can use the TradingView extension for binary options, which can be accessed using this link.