
Before talking about how to use Fibonacci retracement in trading, lets first understand how the term “Fibonacci” came about in trading.
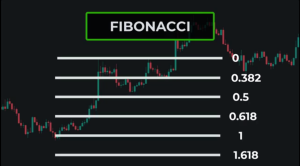
The term “Fibonacci” describes a sequence of numbers that goes from 0, 1, 1, 2, 3, 5, 8, 13, 21, 34, 55, 89, and so on. This sequence begins with 0, and 1 and is created by adding the previous 2 numbers to generate the next number in the sequence. For example, 0 plus 1 becomes 1, 1 + 2 becomes 3, 2 + 3 becomes 5, and so on. The value gotten when taken the ratio of these number is very significant and is what is known as golden ratio.
These numbers are important because they can be seen throughout the universe in different contexts. Like the number of petals on a flower and the number of spirals on a pine cone are examples of this series of numbers in nature.
The ratios derived by dividing numbers from the sequence by other numbers from the same sequence are thought to be important when plotted on a price chart; traders use these ratios to find strong price levels following a strong move in the market in a particular direction.
So in this post, we will be showing you how to use Fibonacci retracement in trading, so lets get started.
Table of Contents
What is Fibonacci Retracements?
Fibonacci retracements are trendlines drawn on a candlestick chart between an absolute low and an absolute high of a trend using the Fibonacci retracement tool.
The Fibonacci retracement tool is a trading chart pattern that traders use to identify trading levels and the range at which an asset price will reverse. The Fibonacci trading ratio can be used to determine whether the trend is up or down.
How To Use Fibonacci retracement In Trading.
If you have been trading for some time, you are probably familiar with the fact that the price of any asset never moves in a straight line, but rather in a zigzag manner.
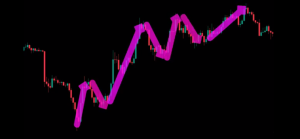
Whenever the price of an asset makes a significant move, as traders, we want to profit from these massive impulsive swings because they usually lead to a pullback. We will attempt to take a long position at the end of such a pullback in order to profit from a significant uptrend.
The challenge is to find when the price is due for an uptrend. Here is where the Fibonacci retracement tool will prove to be useful.
The Fibonacci retracement tool will help to identify potential areas where the price would find support during this pullback if the price is in an uptrend.
Going the other way, when the price is in a downtrend, we will first experience a huge down move, followed by a small up move, which is essentially a pullback. The Fibonacci retracement tool will assist in locating potential resistance levels where the pullback may end and the price may begin a new downward movement.
Steps on How to Use Fibonacci retracement in trading.
In this section, we will guide you through the steps of how to use the Fibonacci retracement in your trading. These steps are outlined below.
Step 1: Identify the trend.
To use Fibonacci retracement in trading, the first thing you need to do is to identify the trend. It can be deduced from the diagram below that we are in an uptrend. This is because we have repeated higher highs.
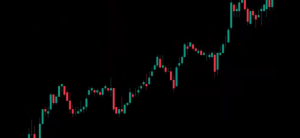
We will only trade in the direction of the trend once we have determined the trend.
Step 2: Determine the swing high and swing low points.
The second step is to determine the most recent swing high and swing low on the chart. Once we have identified these points, we can use the Fibonacci retracement tool to analyze and trade the markets.
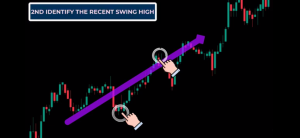
Now, to use the retracement tool, we must first correctly plot the tool. When the price is in an uptrend, we must first find the most recent major swing low on the chart.
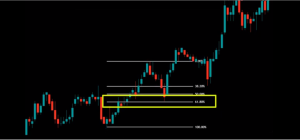
For example, on the chart below, we are experiencing a major swing low, and we must find a major swing high. As you can see, we used the retracement tool to plot it from the low of the swing low to the high of the swing high.
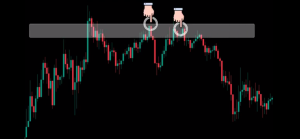
On the other hand, in a downtrend, we will reverse the process. First, we must identify the most recent swing high on a chart, and then identify the most recent swing low.
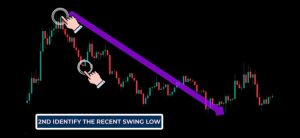
Then, we use the retracement tool and draw from the high of the swing high to the low of the swing low.
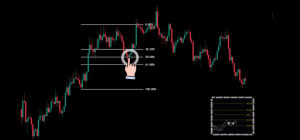
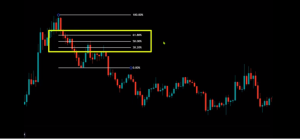
The three lines enclosed in a yellow rectangle below are the Fibonacci retracement levels and since the price is in a downtrend, we expect the Fibonacci levels to serve as a point of resistance.
It is important to note that in a strong directional market, trend pullbacks are very shallow, and the price frequently respects and rarely exceeds the 38.2 percent level. In most mature trends, the price will always tend to respect the 50 and 61.8 percent levels to form support and resistance levels, in an uptrend and downtrend, respectively. The 38.2 level should only be used in very strong trends.
Fibonacci should never be used alone when trading, as is the case with most trading indicators. For this reason, you need to look for more confirmation before entering into any trade. Step 3 and 4 will help us to confirm the trade.
Step 3: Add Moving Average to the Chart.
Moving averages are a very powerful tool that can help us identify high-probability trades. It also helps us identify the trends in the market. Moving averages also act as a dynamic level of support and resistance.
To use the moving average with the fibonacci retracement tool. You will need to add a 50-period exponential moving average indicator to the chart.
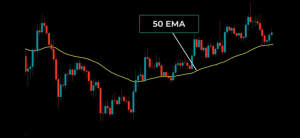
So, on the chart above, we can see that the price has been trading above the 50-period moving average and that the moving average is also moving in an upward direction. This shows that the price is in a strong uptrend. Because our aim is to trade in the direction of the trend, we will only look for buying opportunities.
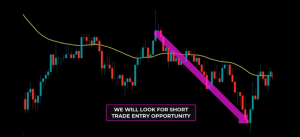
Going the other way, in a downtrend. On the chart below, we can see that the moving average was moving downwards, and the price was trading below the 50-period moving average. Therefore, we can say that the price is in a downtrend, and we will be looking only for selling opportunities.
As we can see, this is an impulsive downward movement, so we identify the swing high and the swing low of the move. Then, we used the retracement tool and draw from the swing high to the swing low.
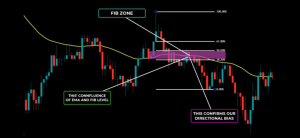
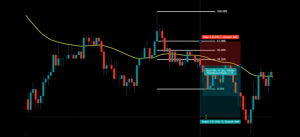
We can see that the 50-period moving average aligns perfectly with the 50-percent retracement level. Because we are in a downtrend, we expect the 50-day moving average to provide resistance to the price. When the price touches the 50 retracement level and the moving average, we expect sellers to come in and take the prices lower.
So we can place our trade as shown in the picture below:
Step 4: Remember to Consider the support and resistance levels.
These are levels where price always react to, after making a downward and upward movement respectively.
The Support level, is a price level where a downtrend can be expected to pause, due to a concentration of demand or buying interest. As the price of an assets drops, demand for the asset increases, forming the support line.
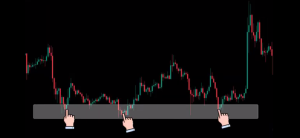
On the other hand, a resistance level is a price level where we expect the sellers to come in and push the price down.
It is important to know that support and resistance levels have a changing characteristic, which means that if the price breaks above a resistance level, then the level will becomes a support.
So before you place your trades, remember to take cognizance that the market tends to reverse at the support and resistance levels, and when this happens, the use of Fibonacci retracement to spot entry signals is not confirmed.
Conclusion
Just like other trading indicators, Fibonacci retracement should not be used alone to make trading decisions. You must make sure you take cognizance of the support and resistance levels, trade in trend direction, and above all, make sure that the signals these factors give coincide before placing your trades. If you understand this, you will know exactly how to use fibonacci retracement in trading.
Disclaimer:
The information on this page is based on our experience and the research we have done and should not influence your financial decision. Please conduct thorough research before making any major financial decisions.
You can refer to our disclaimer page to know how you should treat information on this website.