
In the forex or stock market, knowing how to read volume charts cannot be overstated as it gives a summary of what is happening in the market.
In trading, the major thing that determines how profitable the market is, is liquidity (which is how many opportunities traders have to enter positions) and one of the easiest way to keep track of these opportunities is by understanding how to read volume charts.
If you are someone who is new to trading forex, or the stock market as a whole, and you have been confused about how to read volume charts, then you are at the right place.

In this post, we are going to walk you through a step-by-step guide on how to read volume charts. In addition to that, we are going to show you how to use the moving average indicator to determine whether a trend is breaking out or not.
So, without further ado, let’s get started.
Table of Contents
What is stock volume?
Before talking about how to read volume charts, it is very important to know what stock volume is.
Stock volume is the number of stock shares traded over a particular period of time. A stock share is the smallest unit of a stock tradeable in the market.
In trading, volume literally tells the number of investors in the market over a particular period of time. The higher the trading volume, the greater the number of investors, and vice versa.
A step-by-step guide on how to read volume charts.
Depending on your trading strategy, stock volume can be read on a 1-minute, 5-minute, 30-minute, or any higher timeframe. But for this post, we are going to do it in a 5-minute timeframe, which is the timeframe mostly used in the scalping strategy.
Here’s a step-by-step guide on how to read volume charts.
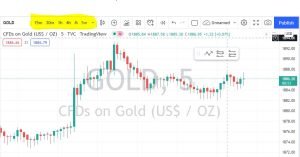
Step 1: Switch to your preferred timeframe.
Before you can learn how to read volume charts, you must switch to the timeframe of your preference.
Depending on your trading strategy, you can switch to 5-minutes, 15-minutes, 30-minutes, or any other higher timeframe.
You can select the timeframe of your preference at the top left corner of the trading view. The position of the timeframe in trading view is indicated with a yellow highlight in the picture below.
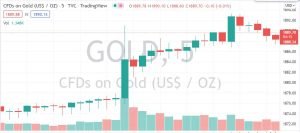
Step 2: Add the volume tool to the chart.
Once you have selected the timeframe of your preference, the next step is to add the volume tool to your chart.
To do this, go to the indicator tab at the top left corner of the trading view, then search for “volume” and click on it to add it to the chart.
Once you add this to the chart, a new box will appear in the upper left corner. Also, at the bottom of the chart, a histogram chart will be added. This box and the histogram will give you an idea of how to read volume charts.
Step 3: Select the bar which you want to read it’s volume.
To read the volume at any point, you need to hover over the bars of the histogram, and you will notice that your mouse will show you the date of each of those bars.
Note that each of the bars is perfectly aligned with the candlesticks, so for any candle you want to know its trading volume, you can do that by hovering over the histogram bar corresponding to it.
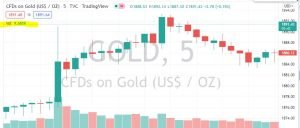
Step 4: Read the Trading Volume of the Candle You Selected.
When you hover over the histogram bars, the corresponding value of trading volume will be displayed in a market watch located at the top left corner of the chart.
The box that will show you the trading volume for each of the bars as you hover of them is highlighted (in yellow) in the picture below.
Moving average on a volume chart.
A moving average on a volume chart is the average number of shares of a stock traded in a particular timeframe over a range of time.
To calculate the 20 moving average, select 20 different bars in the histogram, then note the trading volume of each of these bars, sum them up, and then divide by 20. The value you will get once you evaluate this will give you the 20-moving average of the chart.
Interpreting Moving Averages of a volume chart.
Before you talk about interpreting moving averages in a volume chart, you need to enable the moving average indicator.
To do this, go to the settings of the volume indicator, check the MA, and set the length to 20(you can set it to 50 or any other value depending on your preference). A picture showing how it will look when enabled is shown below.
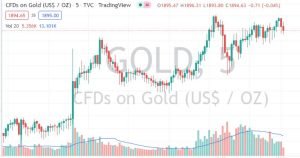
Now the question is, how can this moving average help in trading?
Here is the thing: when the bars of the histogram rally higher than the moving average, investors believe that it is a strong indicator that the stock will continue rising in price, and this is an indication of a strong uptrend.
Value investors, on the other hand, may choose stocks that are currently trading below a moving average in the hopes of finding a stock that is trading “at a discount,” with the expectation that the stock will swiftly return to its “average” price.
What is the difference between a candlestick chart and a volume chart?
The difference between a candlestick chart and a volume chart is that a candlestick chart displays the price changes of the stock over a particular period of time, while a volume chart displays the number of shares of a stock traded over the same period of time.
Conclusion
The volume chart is a true definition of what is happening in the main chart, and knowing how to read it can be handy in helping you identify trends.
In summary, an increase in the trading volume of a stock indicates the higher interest of investors, and more shares of that stock are bought over that particular range of time.
On the other hand, if the trading volume of a stock reduces over time, it indicates that investors have lost interest and that the number of shares of that stock traded over that particular time period has decreased.