
Scalping is a trading strategy that is targeted at profiting from small price movements in the market. Scalping is ideal for traders who do not have the time to spend all day on the chart.
Some of my students always complain to me that because they have other jobs apart from trading, they find it very hard to monitor the market and place their order according to their technical analysis.
The truth is that I don’t advise anybody to quit their job for trading. If you have a job that requires your undivided attention and prevents you from following the market, it is better to use your free time to venture into scalping because while scalping, you can complete 2-3 trades in 3 hours.
Moreover, scalping is perfect for beginners looking to gain faster experience in trading. Success and profitability in trading don’t just happen at once. You need to practice and fail a lot of times before you become proficient.
In this article, I will be sharing with you my Boom and Crash 1 Minute Scalping Strategy.
With this strategy, you can grow your account by catching the spikes that occur in the boom and crash markets. This strategy works on a 1 minute timeframe and can work for Boom 1000, Boom 500, Crash 1000, and Crash 5000.
If you read this article to the end, you will learn how to use this strategy to take your account from $10 to $100 or from $100 to $1000 (10x your account).
Table of Contents
Technical Indicator Needed for this Strategy
The Relative Strength Index (RSI) is the only technical indicator required for this strategy. However, I must remind you that trends should always be your friends.
Relative Strength Index (RSI)
The relative strength index (RSI) is a popular technical analysis indicator used to measure the strength of an asset’s price movement. It compares the magnitude of recent gains to recent losses in the market and then uses the data to determine overbought and oversold conditions in the price of an asset (boom and crash in this case).
The RSI level ranges from 0 to 100. When the signal line of the RSI indicator approaches level 20, it indicates an oversold condition in the market, and traders at this point are looking for a buy position.
On the other hand, if the signal line approaches level 80, it indicates an overbought region in the market, and traders at this point are looking for a sell position.
General Rule for This Boom and Crash 1 Minute Scalping Strategy
The boom and crash indices are known for their sharp price movement in a short period of time. They are a very risky asset, and there are certain rules that I use in trading them to avoid blowing my account. Here are rules you must observe to use the strategy I will be sharing with you today.
- Ensure that there is a clear trend in the 1-hour timeframe. If you are trading boom indices, ensure that there is an uptrend; if you are trading crash indices, ensure that there is a downtrend.
- The strategy I will sharing with you here only works in the 1-minute timeframe.
- Don’t Enter a sell position on Boom 1000, Boom 500, and Boom 300. Trade only to catch the the upward spike in Boom indices.
- Don’t enter a buy position Crash 1000, Crash 500, or Crash 300. Trade only to catch the downward spike in Crash indices.
- Always set a stop loss to avoid losing too much money when the market goes against you. There is no strategy that works 100% of the time.
How to setup chart for Boom and Crash 1 Minute Scalping Strategy
Step 1: Select the Index you want to trade
The first step is to select an index that you want to trade. This strategy that I will be sharing here works for Boom 1000, Boom 500, Crash 1000, and Crash 500. So go ahead and add any of them to the chart.
I use Tradingview for synthetic indices trading, If you like the platform, you check my guide on how to find synthetic indices on Tradingview.
Step 2: Add the RSI indicator to the chart:
Add the RSI indicator to the chart, click on the setting Icon, navigate to the input tab, and apply the following setting:
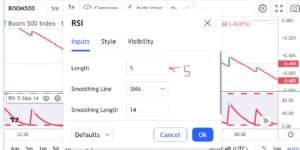
Note: the length was changed to 5.
After the above setting, navigate to the Style tab and apply the following setting:
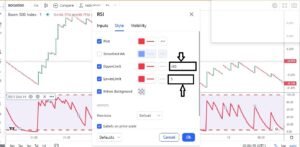
Note: the level of the RSI was set at upper and lower limit of 100 and 5 respectively.
Step 3: Switch to the 1 Minute Timeframe
Because this is a one-minute scalping strategy, all entry points must be identified within the one-minute timeframe. You must, however, ensure that you identify a trend in the 1-hour timeframe and then trade along with it.
When to Place a Sell order on this Trading strategy
As earlier said, you must only sell orders when you are trading Crash 1000 or Crash 500 with this strategy. After setting up the chart as directed above, make sure you adhere to the following rules before you place a sell order.
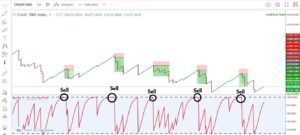
- Ensure you Identify a downtrend from 1H timeframe before placing a sell order.
- Ensure the signal line cross the overbought region of the RSI before placing a buy order.
- Ensure set a stop loss order for any trade you enter.
- Close your Trade after 2 successive spike.
- If you short candles starts forming after first spike, ensure you close position 4 short candles after the spike
When to Place a buy order on this Trading strategy
Just like I said before, you must only buy when you are trading Boom 1000 or Boom 500 with this strategy.
After setting up the chart as we directed above and selecting a boom index, you must wait for the following condition before going long.
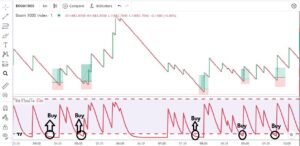
- Ensure you Identify an uptrend from 1hour timeframe before placing a buy order
- Ensure the signal line cross the oversold region of the RSI before placing a buy order
- Ensure set a stop loss order for any trade you enter.
- Close your Trade after 2 successive spike.
- If you short candles starts forming after first spike, ensure you close position 4 short candles after the spike
How to flip $10 to $100 (10x your account) using this Strategy)
The above picture shows five successive trades I took in a day, and on average, each of them gave me $8. So five of them had a compounded profit of $40. Though it may not happen every day, if you earn $10 per day using this strategy, you can 10x your account in 10days.