
Looking for how to analyze synthetic indices on TradingView? That is utilizing TradingView’s amazing charting tools to analyze either volatility indices, crash and boom indices, step indices, or range break indices. Welcome. In this guide, we will show you how to do that.
TradingView, the best charting and technical analysis platform on the internet, has a new extension that allows you to analyze synthetic indices using their awesome charting tools.
These new features can help you visualize market behavior in ways that the normal Deriv platform simply cannot, thus enhancing your ability to identify potential trade setups and profit from them with minimal risk.
So let’s get started.
Steps To analyze Synthetic Indices on TradingView.
If you are looking for how to analyze synthetic indices on TradingView, then follow the steps below.
Step 1: Visit the New Extension.
To access the new Tradingview feature(extension) that allows you to analyze synthetic indices, follow this link. You will be taken to a page looking like the screenshot below:
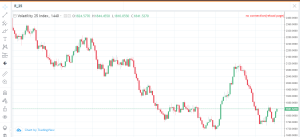
Step 2: Remove “R-25”.
In the top right corner of the chart, you can select the particular indices you want to trade. By default, “R-25” is selected. This is shown in the picture below.

So, you need to delete the default and then click on the search bar.
Step 3: Navigate to Synthetic Indices Market.
Once you click on the search bar, you will see different market options beneath it. Then navigate to the synthetic indices market. This will load different indices that you can select and analyze on the chart.
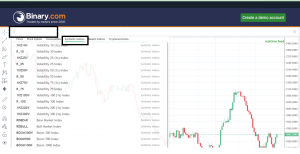
Then select one.
You can also search for the name of the indices you want to trade, once you are on the “synthetic indices” market tab.
Step 4: Do your Analysis.
Having selected the indices you want to trade, you can go ahead and analyze the market. One cool thing about using TradingView to analyze synthetic indices is that it gives you access to a wider view of the chart.
After you have finished your technical analysis, you can then proceed to your trading app to mark your point of interest and then wait for the price to get there.
<< Start Trading Boom and Crash Now >>
Step 5: Trade
When you are done with your technical analysis on Tradingview extension, you can then go back to your trading app, mark the point of interest as determined in your analysis, and wait for the price to get there.
This is how to analyze synthetic indices on TradingView. If you have any questions, you can leave them in the comment section below. I will make sure I attend to them.
Also remember that the financial market is unpredictable, so always risk what you can afford to lose.