Synthetic indices trading can be very profitable when you understand the market well and use a good charting platform to do your analysis.
While there are several different charting platforms you can use to trade Synthetic indices, one of the most popular in recent years has been Tradingview.
This platform (Tradingview for Synthetic indices) allows traders to analyze Volatility indices, Jump break indices, step indices, and Boom and Crash indices. With its easy-to-use interface and advanced charting tools, you can easily discover opportunities and leverage them.
In this article, I will show you how to use Tradingview for synthetic indices trading. So let’s jump right into it.
Table of Contents
What is TradingView for Synthetic indices?
Tradingview for Synthetic indices is a web-based charting platform that offers a wide range of features for technical analysis. With the platform, you can create charts, analyze Volatility indices, Jump break indices, step indices, and Boom and Crash indices to discover opportunities in the market and leverage them.
Most of the Synthetic indices brokers don’t have the features and resources that this platform (Tradingview for Synthetic indices) have, the only feature most synthetic indices brokers provide is a simple line graph with the price of the underlying instrument that is being traded and this feature is not enough to inform your decisions in trading.
Understanding The TradingView for Synthetic indices UI
If you are familiar with the normal TradingView charting platform, then using “TradingView for Synthetic indices” shouldn’t be a problem for you. The two platforms have the same UI. The only difference between them is what is being analyzed.
This charting platform looks like the image shown below. Lets look at it in sections.
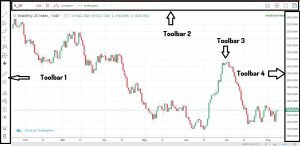
Toolbar 1:
This toolbar is what holds the charting tools available in this charting platform. Here you will find drawing tools, zoom in to the chart, add text to the chart, delete some drawings on the chart and perform most other functions. In fact, all the drawing tools normally available on the regular TradingView can be found here. You can hover over any of the tools to see a tooltip.
Toolbar 2:
In this toolbar section, you can choose the synthetic indices that you want to trade, candle type of the chart, timeframe, or undo and redo functions. Also, at the top right corner, you will find the option to change some settings, take a screenshot, or save your chart.
To find the synthetic indices on this platform, remove the “R_25” at the top right corner of the page and select the synthetic indices market as shown below:
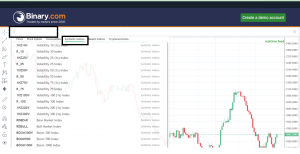
You can then select the synthetic index you want to trade and it will be added to the chart.
Toolbar 3:
When you select a trading element or start making use of those drawing tools available on the platform, it will have an effect on this area. This candlestick is a real-time representation of the market data of any synthetic index you are trading.
Toolbar 4:
This toolbar is where the price of the option you are analyzing is shown.
How to Use TradingView for Synthetic indices Trading (Steps).
Trading Synthetic indices on this platform is very simple. You must first open an account with one of synthetic indices broker. Find the specific index you want to trade, analyze the market, and place your order with your broker. Here’s a step-by-step guide on how to do this.
Recommended: How to Analyze Synthetic Indices on TradingView
Step 1: Register with Option Broker.
As Tradingview for Synthetic indices is just a charting platform, it doesn’t offer any brokerage services. So, in order to use the platform for option trading, you must first register with a broker, with whom you will place orders. Popular option brokers are Deriv, etoro, and Exness. You can find more option brokers here.
Step 2: Visit the Tradingview Extension Synthetic indices
Follow this link to visit the Tradingview extension for synthetic indices. You will be taken to a page looking like this:
Step 3: Select the “synthetic index” you want to trade:
Once you visit the page as directed above, you will find a window to change the options in the top right corner of the chart. By default, “R-25” is selected. This is shown in the picture below. Remove it.

Once you remove the default indices, you will see more different market categories like forex, commodities, synthetic indices, and others. Then navigate to the synthetic index market and select the index you want to trade.

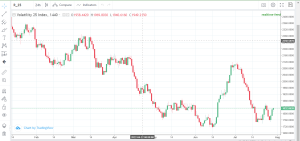
Step 4: Do your Technical analysis and place your trade.
After selecting the synthetic indices you want to trade, the real market data will be launched in the candlestick chart area. You can go ahead and implement your technical analysis.
Once you are done with your technical analysis, you can proceed to your broker’s platform to mark your point of interest and wait for the price to get there.
Conclusion
Tradingview for synthetic indices gives traders countless benefits. With this platform, you can access the real-time market data of Volatility indices, Jump break indices, step indices, and Boom and Crash indices and implement your analysis all in one place. The platform is free and has a good UI just like the normal Tradingview.